Back
August 27, 2013
Scalability Through Event and Session Tracking With Angler.js
At Sold., a core part of our work funnel includes pricing items before we sell them. Although most prices are determined through our integrated pricing algorithms, we still require human eyes to assure quality in the pricing process and maintain high customer satisfaction. Until recently, we could only make rough estimates of what was working and what wasn't in this process. That's where Angler.js comes in.
Built with scalability in mind, Angler provides us with the data necessary to see what we can improve. Angler records timestamps marking the beginning and end of each block of user activity within a page, while storing them within the context of the last event triggered by the user. Events are essentially interactions with elements on a page, and Angler can be set to record either all page events, or exclusively tagged events.
Angler also ignores periods of user inactivity, meaning that when you leave your computer, Angler will mark the end of an activity block, and append a new start and end activity time when you return.
By having timestamps stored directly within the context of the last event, we can track how long it takes to complete each step of the pricing process. If there is a certain step that is taking longer than intended, it can easily be recognized and redesigned to reduce the interaction time required on a task. With such a high amount of items coming through, even optimizing a single step to be 30 seconds faster will mean hours of productivity saved.
Angler's data is so precise that it can recreate a near perfect visualization of the average user's interaction with a certain page. Heat map overlays and A-B Test comparisons are also easily achievable with Angler data. In our case, we have rendered graphs representing the average time a user is active before performing a certain event (essentially, how long it takes to complete a section of the pricing funnel). Additionally, these graphs are mapped over time so that if we change the pricing process, we can track whether or not it has become faster.
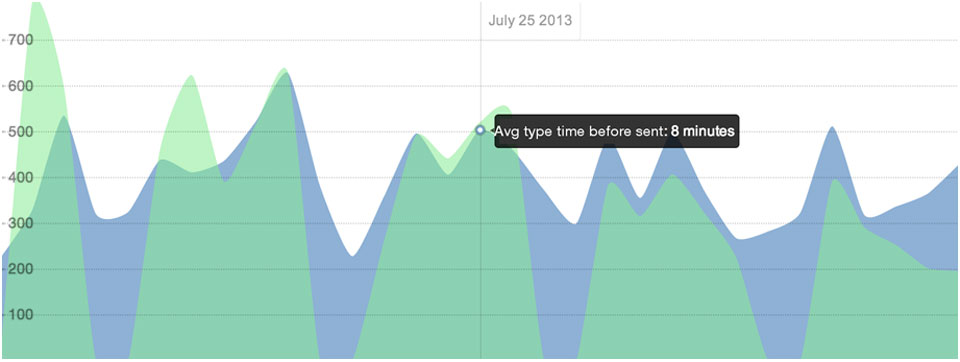
Angler data can be used to compare the overall typing time for a certain element on a day-by-day basis
Angler data can also be rendered to display performance on both an overall basis, as well as on a user by user basis. This means that we can see key statistics, such as a strong correlation between the items a certain employee prices and the price rejection rate.
Here's how to use Angler:
Download angler.js from our git repository here: https://github.com/usesold/Angler.js
Next, if you don't already have it, you will need to download jQuery in order for Angler to function properly.
Starting Angler is as simple as:
<script src="../angler.js"></script>

<script>
    angler.start({
        heartBeat:10000,
        isTagOnly: true,
        isSaveTagOnly: false
    })
</script>
Tag any elements you want tracked with an event name (spaces are allowed):
data-angler="Event Name"
Or, if you call angler.start() with isTagOnly and isSaveTagOnly set to false, all clicks will be tracked as individual events.
And that's it!
Angler will now start posting data to '/angle/:sessionId', which you can have your server handle and save to your database. You may also pass { postLocation : 'yourPostPath'} as a start config to have Angler post data to a location of your choice.
All incoming data will conform to the following schema:
    var anglerSession = {
        path                 : "string", //the url of the page data is being posted from
        sessionId            : "string", //the id of the current Angler session.
        user                 : "string", //optional; can be populated either on client side or server side
        events: [{                       //the first event on every page will always be page loaded
            nodeName             : "string", //type of element clicked on page
            elementIdName        : "string", //id of element clicked
            elementClassName     : "string", //class of element clicked
            data                 : "string", //event name, if specified (pulled from data-angler="Event Name")
            href                 : "string", //if the element is a link, it will store the href tag
            timeStamps:    [{
                start : int, //these are each unix integers representing a time stamp
                end   : int
            }]
        }]
    }
You can find extended documentation and info at https://github.com/usesold/Angler.js, as well as a live example (of some very simple data rendering) at www.sdrobs.com/home/angler.
On a final note, it should be said that Angler was not built either to spy on, or individually track or target users. We at Sold are using it solely to gain a holistic view of our pricing funnel and associated workflows.
Have fun and Angle responsibly!